Design For Information by Isabel Meirelles
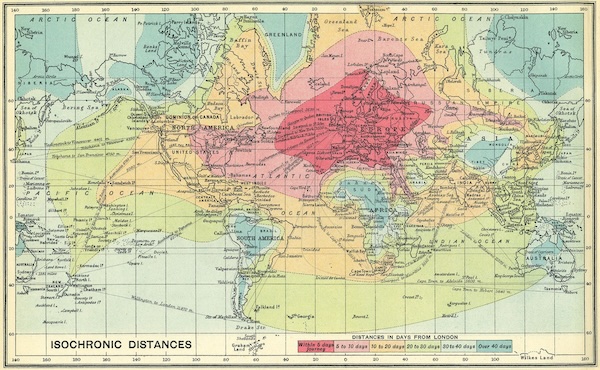
Isochronic distances from London to the rest of the world
1914
Il Mondo Contemporaneo
Reading notes.

Design for Information: An introduction to the histories, theories, and
best practices behind effective information visualizations (Rockport, 2013)
offers an integrative approach to learning basic methods and graphical
principles for the visual presentation of information. The book surveys
current visualizations that are analyzed for their content (information)
as well as for their methods of presentation and design strategies (design).
The objective is to provide readers with critical and analytical tools
that can benefit the design process of visualizing data. While the book
targets design students, it can be helpful to students in other disciplines
involved with visualizing information, such as those in the (digital)
humanities and in most of the sciences. My intention was to represent
all disciplines in the book by including content and authors from diverse
disciplines. It is my hope that the book will help broaden the dialogue
and reduce the gap between two communities —designers and scientists—
and foster problem-solving skills in designing for information.
*
* ---
*
Design for Information
Isabel Meirelles
Rockport Publishers
(2013)

8 - English route maps -> strip form (1675)
8 - French train schedule -> graph overlay (1885)
9 - London Tube Map (1933)
9 - "Design Lexicon" context of visualizing information

18 - hierarchical structures /// trees /// hierarchy
22 - pre-attentive features -> 5 tasks and on page 23 a list of 16
22 - conjunction searches
30 - tree maps -> page 32 has four common layout options
35 - comparison of graphical representations of quantiles
45 - Voronoi treemaps

47 - relational structures /// networks /// graphs
48 - graph theory
49 - bipartite graphs or two-mode or affiliation network (sociology)
49 - also the corresponding one-mode projections of bipartite graphs
51 - directed
62 - most common types of network layouts
66 - alluvial diagram
70 - Sankey diagrams - flow diagrams

83 - temporal structures /// time /// timelines
88 - uniform timelines
93 - first bar graph
94 - cyclic / polar graph
104 - history flows
109 - streamgraph method

115 - spatial structures /// maps /// relative positions
116 - thematic maps
118 - map projections
121 & 123 - map scale
124 - visual encoding
129 - visual illusions
130 - dot distributions maps
130 - nomograph
138 - graduated symbol maps
141 - scaling of symbols -> proportional to area
142 - choropleth maps
148 - isometric and isopleth maps
152 - flow & network maps
156 - area & distance maps

159 - spatio-temporal structures
161 - *** - "Isochronic passage chart for travelers" (1881) days from London
162 - space-time cube
163 - Minard's 1869 "Napolen's march to and from Russia 1812-1813"
167 - isochrone lines
171 - West-Road from London to Bristol (1676) - towns and positioned text & with distances…
180 - trajectories
182 - clustering trajectories

185 - textual structures /// language /// words /// documents
189 - lexical, syntatctic, semantic
193 - typographic elements
194 - word cloud

204 - data types: nominal, ordinal & quantitative

[Sidebars]
19 - proximity
33 - closure
51 - similarity
58 - good continuation
97 - magical number seven
126 - segregation between figure & ground
129 - relative judgments of perception
141 - making meaningful groups
145 - luminance illusions
146 - selecting color schemes
187 - nominal data