The Federal Register is "the official journal of the federal government of the United States".
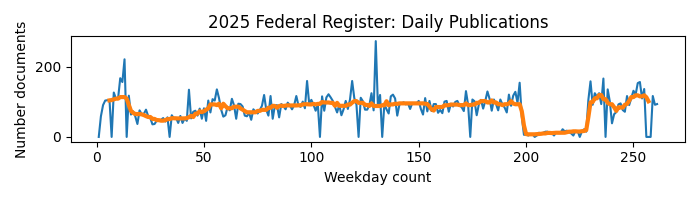
From the 2025 raw publication data, we can tally the number of publications per day (median of 82).
We can then compute the rolling median:
df['rolling median'] = df[fr_col].rolling(window=10, min_periods=1).median()
This can then be plotted with the raw data in blue and the rolling median in orange.

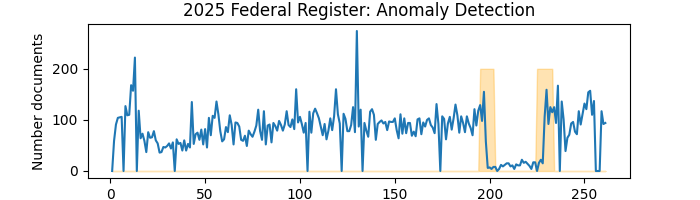
Finally, we can go back to the raw data and apply anomaly detection.
Using Anomaly Detection Toolkit or ADTK the LevelShiftAD method can be applied to the raw data.
level_shift_ad = LevelShiftAD(c=4.0, side='both', window=10)
The results are plotted below with the raw data in blue the anomalous regions in pale orange.