This post is some back story for the Gem D3 repo.

A while back I took a data visualization class. The class ended up being a D3.js class, which in turn ended up being a JavaScript class.
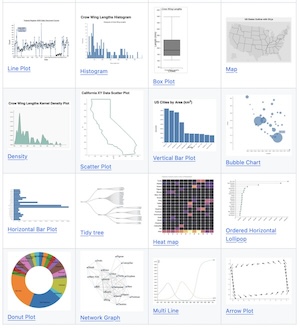
On top of the homework, I ended up writing a series of example functions for common and more interesting visualizations.
Compared to matplotlib or seaborn, it might take a fair amount of code to generate a specific chart. For example, this box plot function is over 100 lines of code.
Observable is a great option but nothing like having a collection of functions handy.
So as a mini-refresher I had Gemini CLI write a similar library but just from a set of input data and a prompt.
For example this data (which tallies character co-occurences per chapter for Alice in Wonderland) was used with this prompt :
Write a Javascript function to generate a d3.js force-directed network
graph for the input data file alice.json.
The function should take input parameters of input data file name,
plot width and plot height.
This data consists of nodes that are characters in Alice In Wonderland.
The edges or links in this data are chapters in which both characters
are mentioned.
The graph nodes should be labeled.
Generate the JavaScript code and save to file: force_directed_graph.js.
Also generate an index.html file to call this javascript function.
Do not start any processes to install or invoke an http server.
The resulting interactive force-based network is below:
Not bad. Read through the code and in some cases made minor edits to the code.
One occasional error was new-line handling, but that was easy to spot. But reading the code I was also reminded of some of JavaScripts idiosyncrasies (ah yes converting from a string to a number using d[xColumn] = +d[xColumn]; ).
One nice thing about using visualization as a test case was if it rendered in a browser it was a pretty good initial test of the code. In addition, the D3.js plots were compared to corresponding matplotlib (or other python library) renderings.
So with Gemini CLI I was able to turn 10 datasets into 1,500 lines of useful code.
Another example was plotting a map of the states of the USA.
Which it did. Neat. So then I tried to get a plot of the James River in Virginia.
This spent a long time doing nothing. Gemini CLI tried multiple approaches to finding the data but failed. As a result the Gem D3 repo does not include a James River plot.
Which highlights one limit of Gemini CLI generated D3.js code.
If specific data is required but not available, it will only generate at best a partial answer.
So in addition to being software shaped maybe being data shaped helps with